Evolution of overall ENTSO-E consumption
Yearly energy consumption
In 2015, ENTSO-E consumption reached 3,278 TWh, which represents a 1.4 % increase compared to the previous year. The following reasons may explain this increase:
- Meteorology: average 2015 temperatures were lower at the
beginning of the year, and higher in summer; - Economy: the GDP rose by 1.8 % in the EU28 over 2015
compared to 2014 (Source: Eurostat).
We observe an increasing use of electricity (e. g., electric vehicles), despite improvements in energy efficiency of buildings, lighting and appliances.
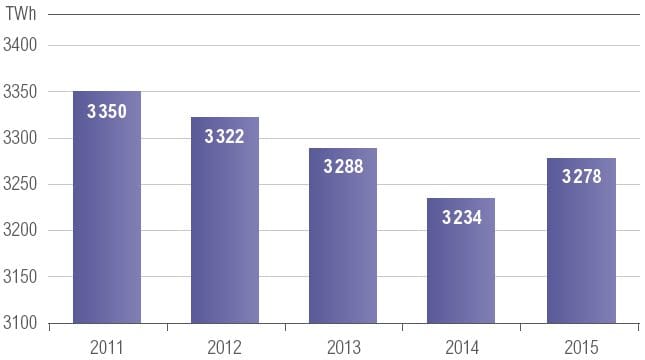
Yearly energy consumption in TWh
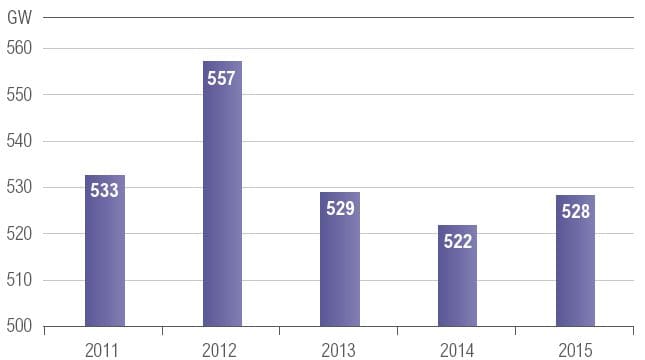
Maximum peak load in GW
Estimated amount of own consumption is included.
Peak load
Associated with the cold snap of February 2015, the peak load was higher than 2014 and reached 528 GW on 5 February 2015. This peak is comparable to the 2013 peak, and is still 30 GW lower than the peak load registered during the cold period of February 2012.
Evolution of consumption per country
The majority of ENTSO-E countries observed an increase of their consumption between 2014 and 2015. For some countries, particularly France, where electric heating is important, this increase can mainly be explained by colder winter weather conditions.
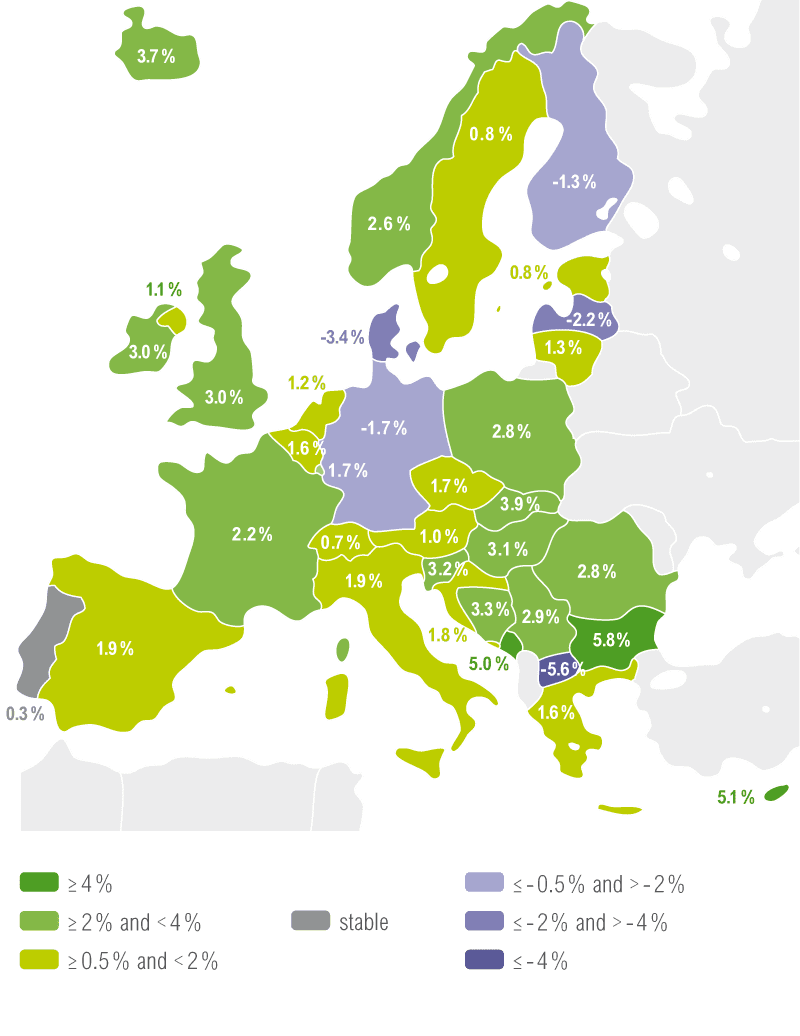
Evolution of electricity consumption between 2014 and 2015