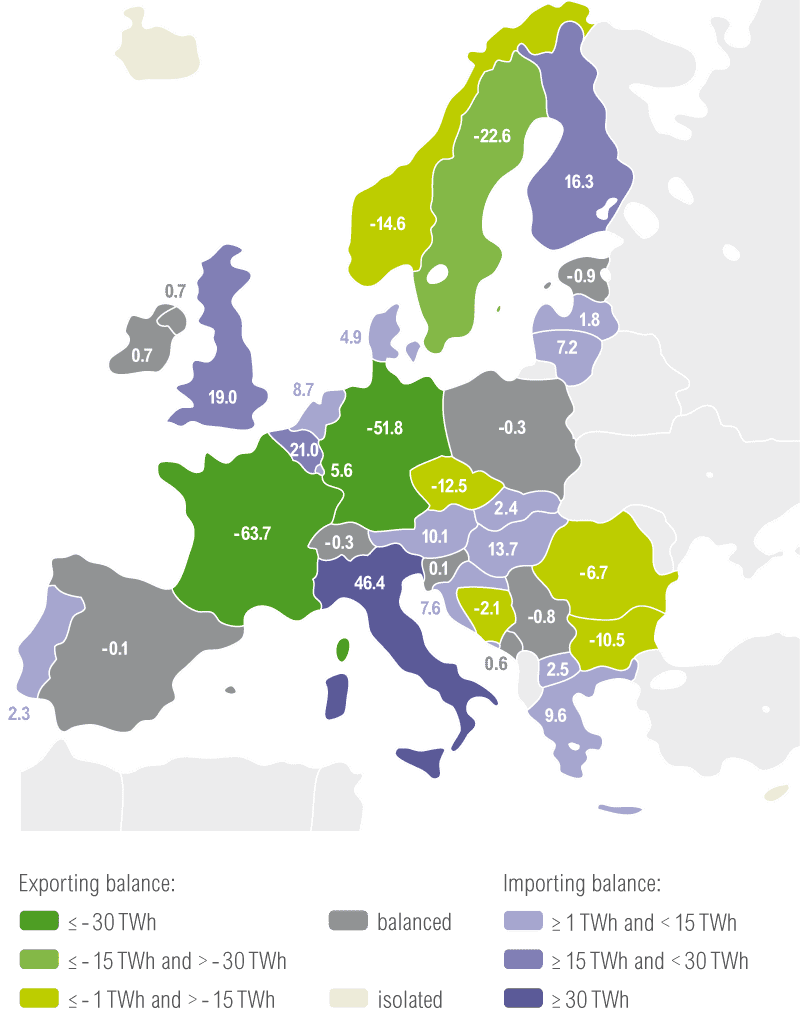
Exchange balances per country
The exchange balance of a country can fluctuate from year to year, linked to border capacities, market coupling and price influences, even if some countries are structurally importing or exporting. The balance of electricity exchanges is the balance between the energy physically flowing in and out of a country.
It equates to the balance of commercial transactions of each country (exports minus imports). However, in an interconnected system where electricity disperses through various paths, the energy’s physical flow through a specific border between two countries usually differs from the commercial energy transactions between these two countries.
Exchange balances in 2015
.
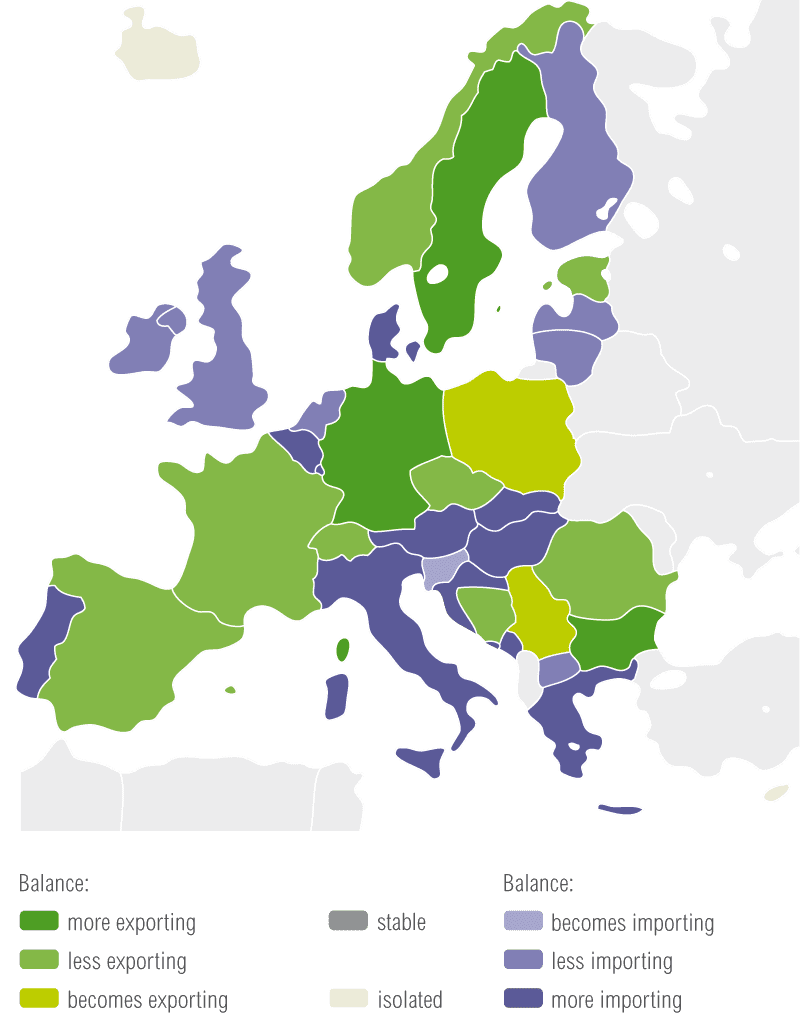
Evolution of exchange balances between 2014 and 2015
Exported generation
Consumption from national generation
The share of electricity generation of a country which is physically exported to its neighbours, is the ratio between the country’s net exports and generation. In 2015, 12 countries of ENTSO-E’s perimeter exported more than 10 % of their annual national generation to neighbouring countries. This includes exchanges of each country with its neighbours, both within and outside of ENTSO-E.
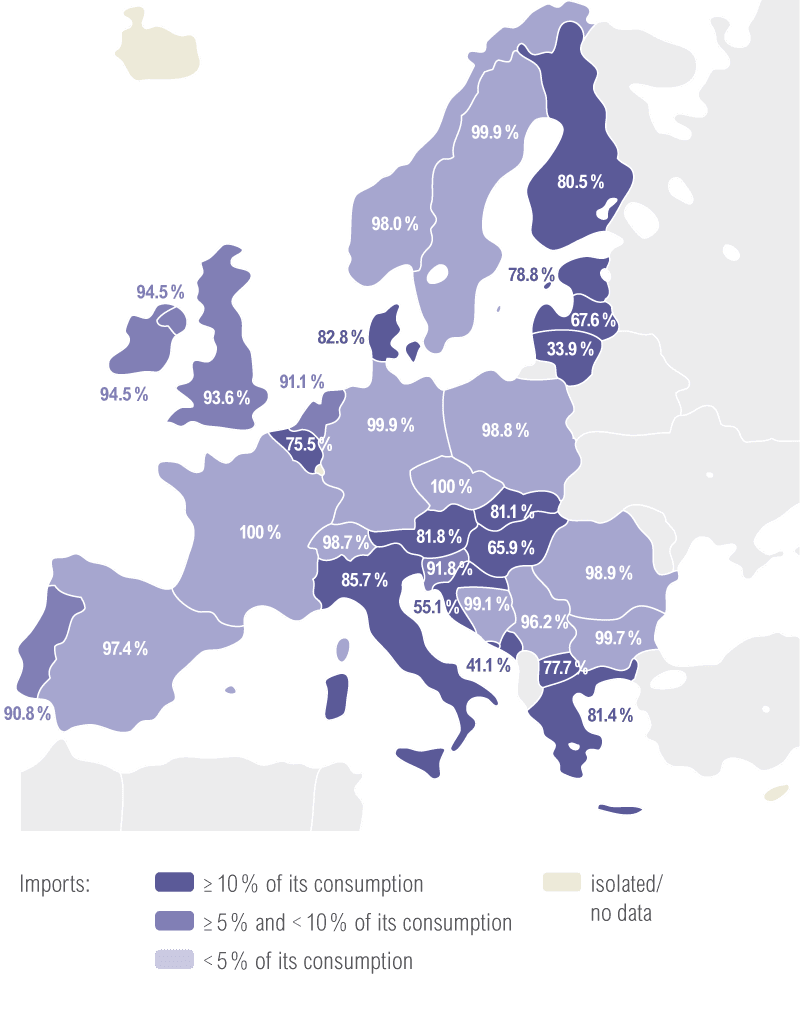
For each country, the ratio between its imports and its consumption represents the share of its yearly consumption, which is covered by physical imports from its neighbours. In 2015, 14 ENTSO-E countries imported more than 10 % of their annual internal consumption needs from other ENTSO-E countries.
Share of yearly generation exported
Share of yearly consumption covered by national generation
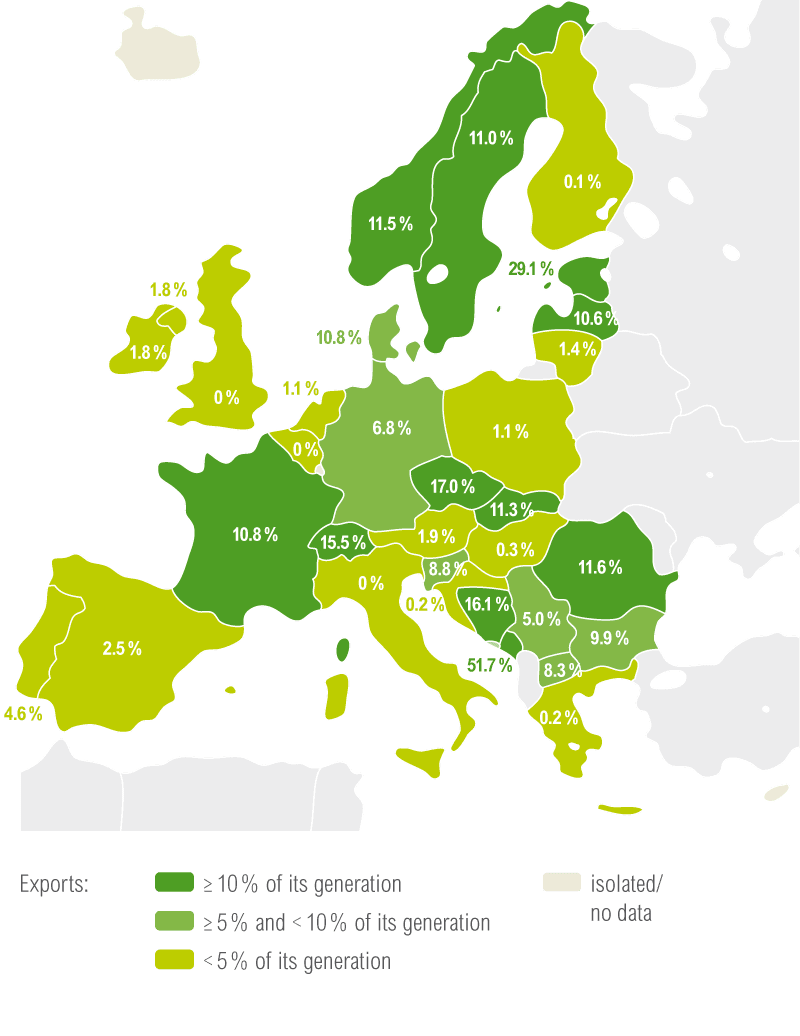
These two Figures are based on “net exports” and “net imports” calculations, excluding transit and loop flows. Net balance of exchanges per country are calculated on an hourly basis.
Adding net balances separately, whether positive or negative, gives the amount of net exports and imports of the country. Exports and imports can be driven by market conditions or adequacy needs.
Exported generation
The share of electricity generation of a country which is physically exported to its neighbours, is the ratio between the country’s net exports and generation. In 2015, 12 countries of ENTSO-E’s perimeter exported more than 10 % of their annual national generation to neighbouring countries. This includes exchanges of each country with its neighbours, both within and outside of ENTSO-E.
Share of yearly
generation exported

These two Figures are based on “net exports” and “net imports” calculations, excluding transit and loop flows. Net balance of exchanges per country are calculated on an hourly basis.
Consumption from national generation
For each country, the ratio between its imports and its consumption represents the share of its yearly consumption, which is covered by physical imports from its neighbours. In 2015, 14 ENTSO-E countries imported more than 10 % of their annual internal consumption needs from other ENTSO-E countries.
Share of yearly consumption covered by national generation

Adding net balances separately, whether positive or negative, gives the amount of net exports and imports of the country. Exports and imports can be driven by market conditions or adequacy needs.


