By the end of 2015, total ENTSO-E NGC was 1,030 GW. Whilst NGC was stable with respect to nuclear and hydro, non-hydro renewable energy sources increased by 20 GW (+ 8.6 % compared to 2014), and represented 25.1 % of total NGC of ENTSO-E. In contrast, fossil fuel NGC decreased by 3.3 %.
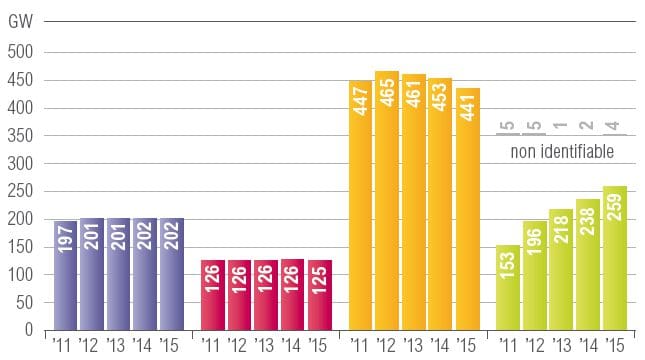
Net generating capacity from 2011 to 2015 in GW
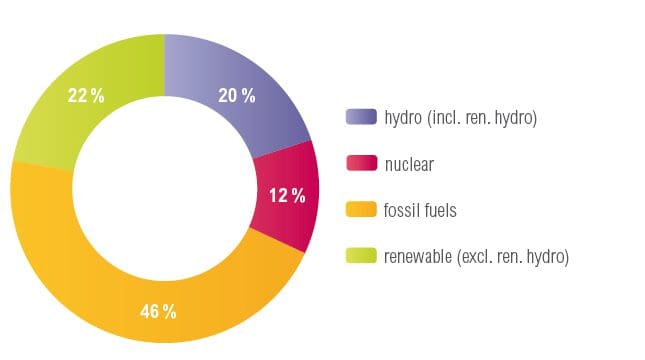
Net generating capacity in 2015
Evolution of overall ENTSO-E energy net generation
The low rainfall of 2015 affected hydro generation, which decreased by 6.5 %. This decrease, coupled with the reduction of nuclear generation, was partially compensated by the increase in renewable generation (+17.3 %), mainly driven by solar and wind, which increased by 24.6 % and 3.1 %, respectively. At the same time, fossil fuel generation increased by 1.1 %.
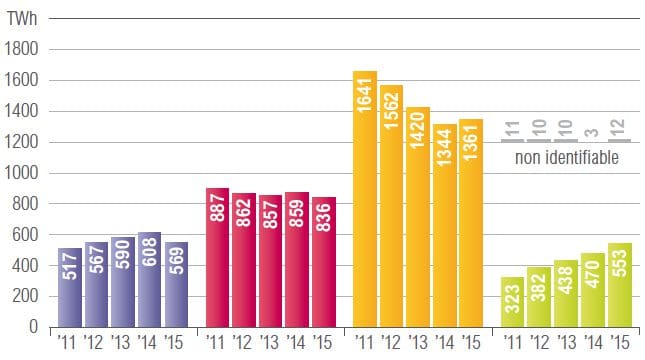
Energy net generation from 2011 to 2015 in TWh
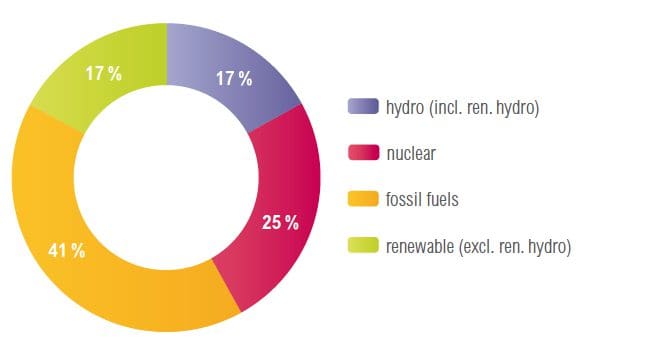
Energy net generation in 2015
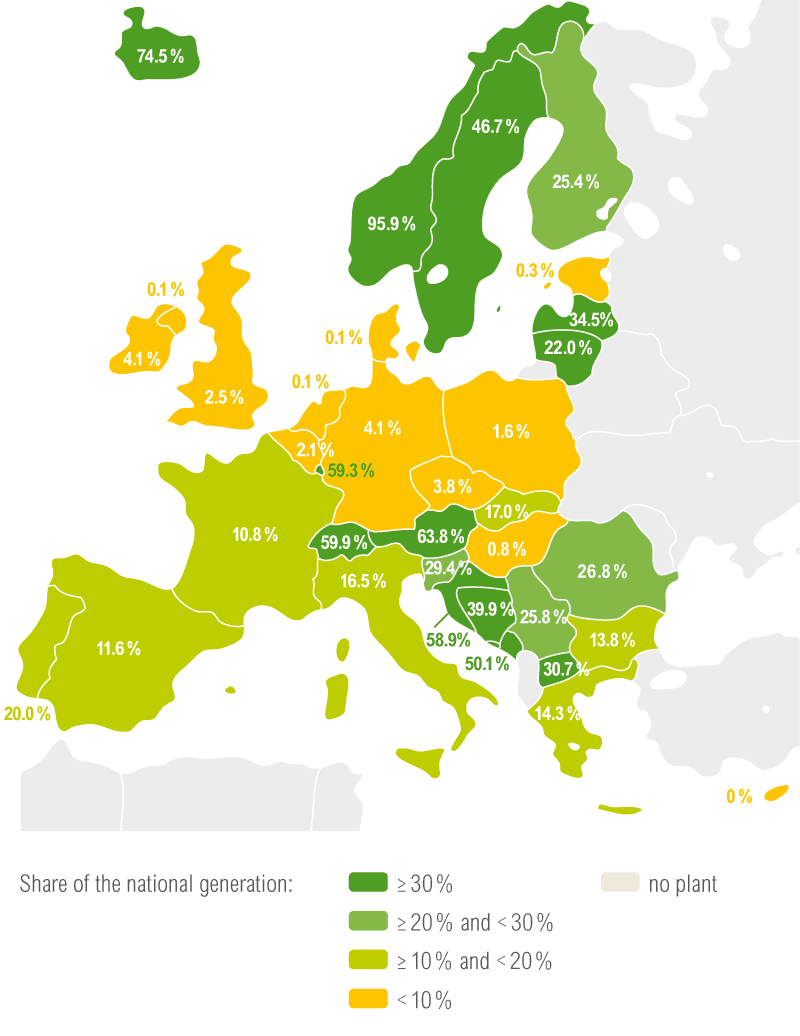
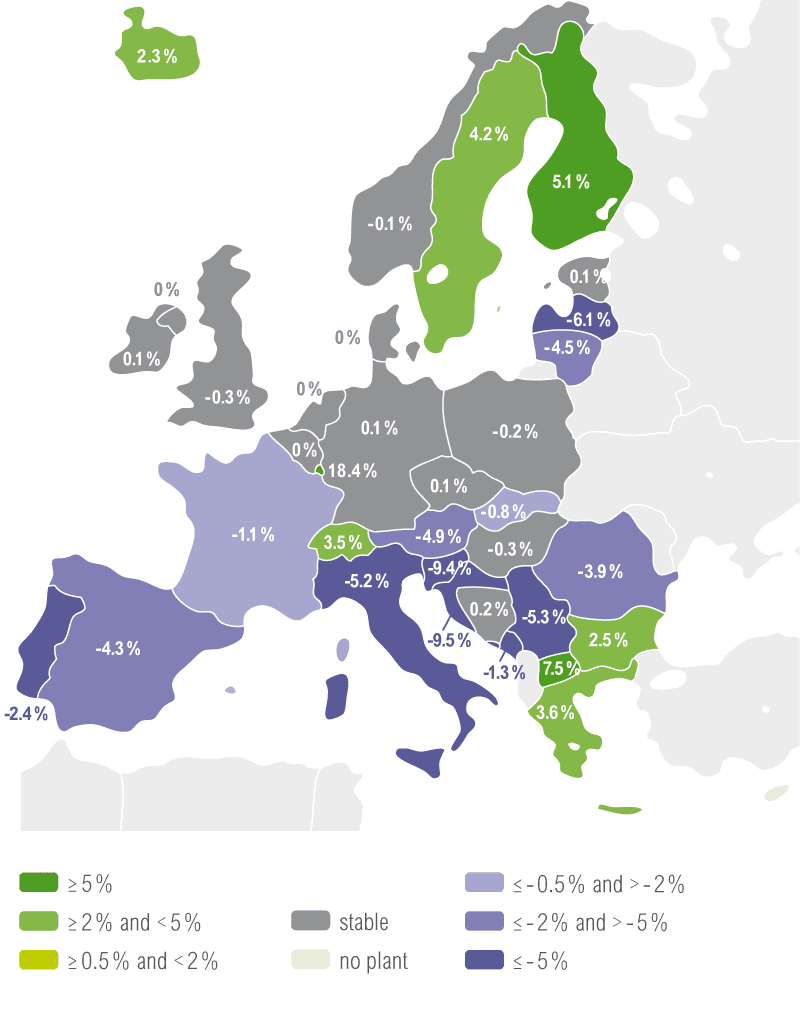
Net generation per country
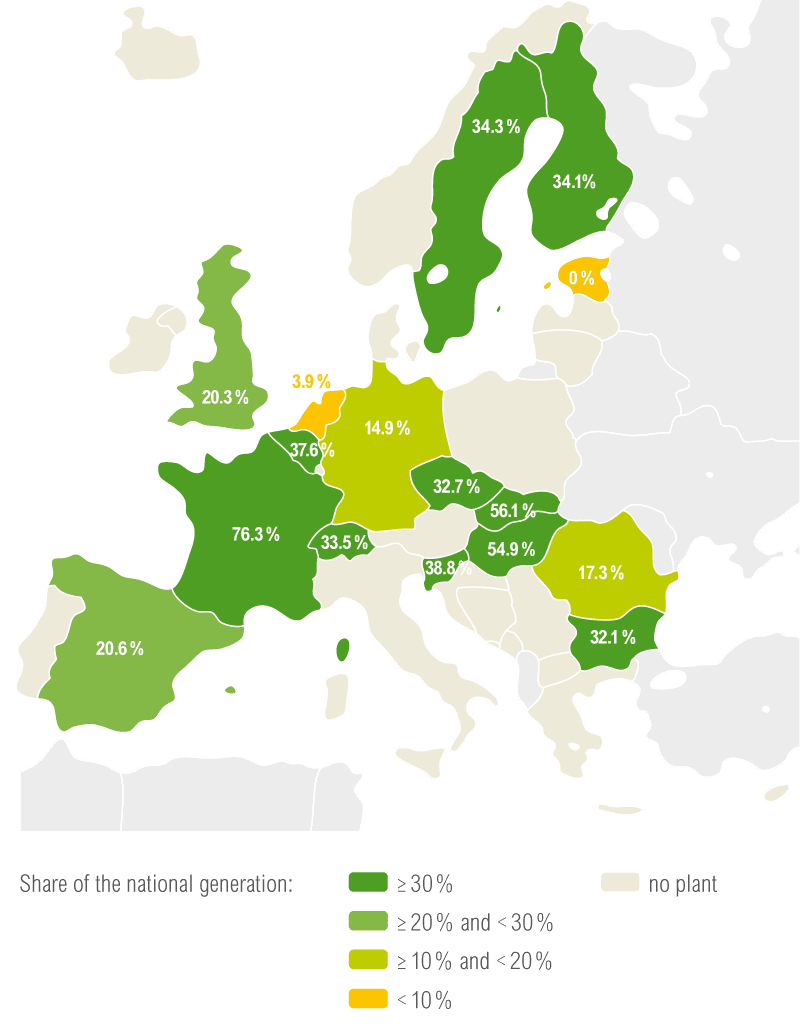
Hydro energy
In Europe, hydro power plants are concentrated in the transalpine range, the Carpathians and the Scandinavian countries, where hydro generation represents up to 96 % of total national generation. Although hydro capacities have not significantly evolved further, generation is highly dependent on rainfall, which differs from one country to the next.
Share of hydro energy net
generation in 2015
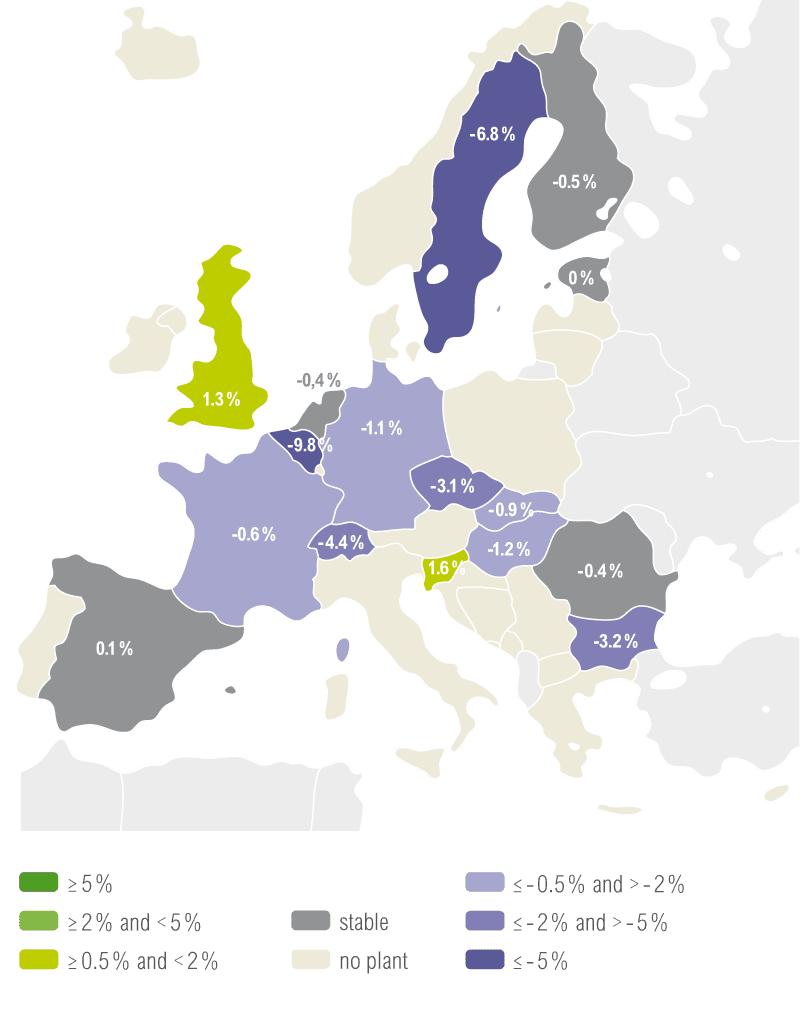
Evolution of hydro coverage
ratio in percentage point
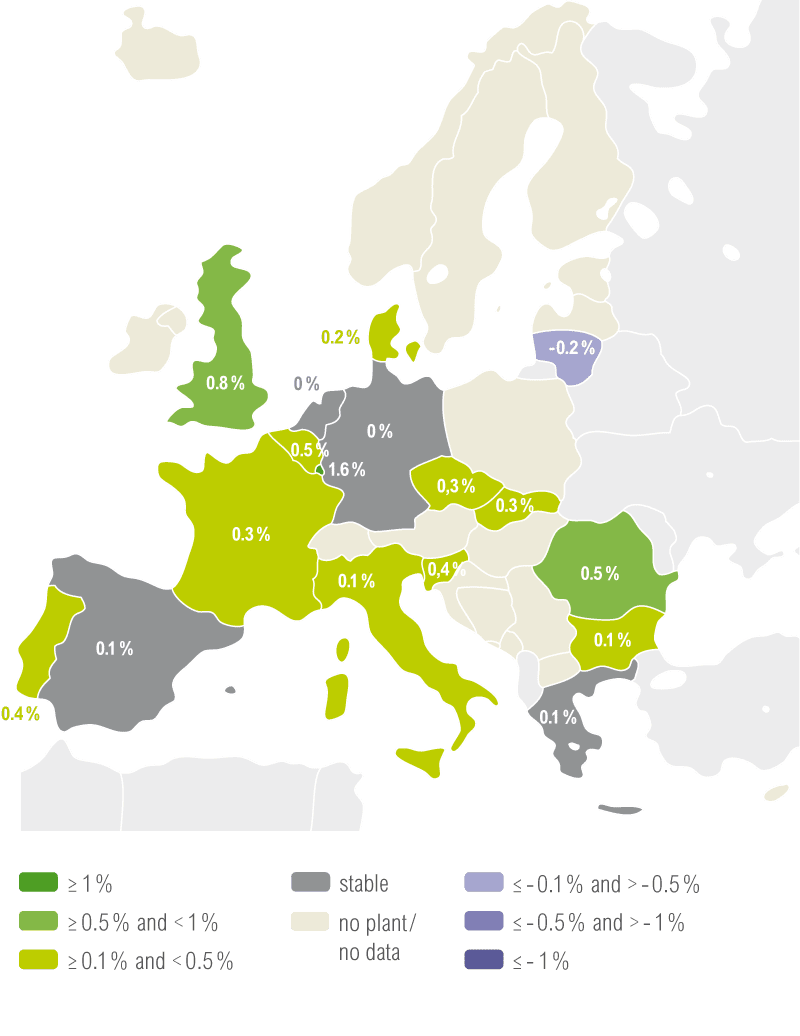
A percentage point (pp) is the arithmetic difference between two percentages
(for example going from 4 % to 7 % is a 3 percentage point increase)
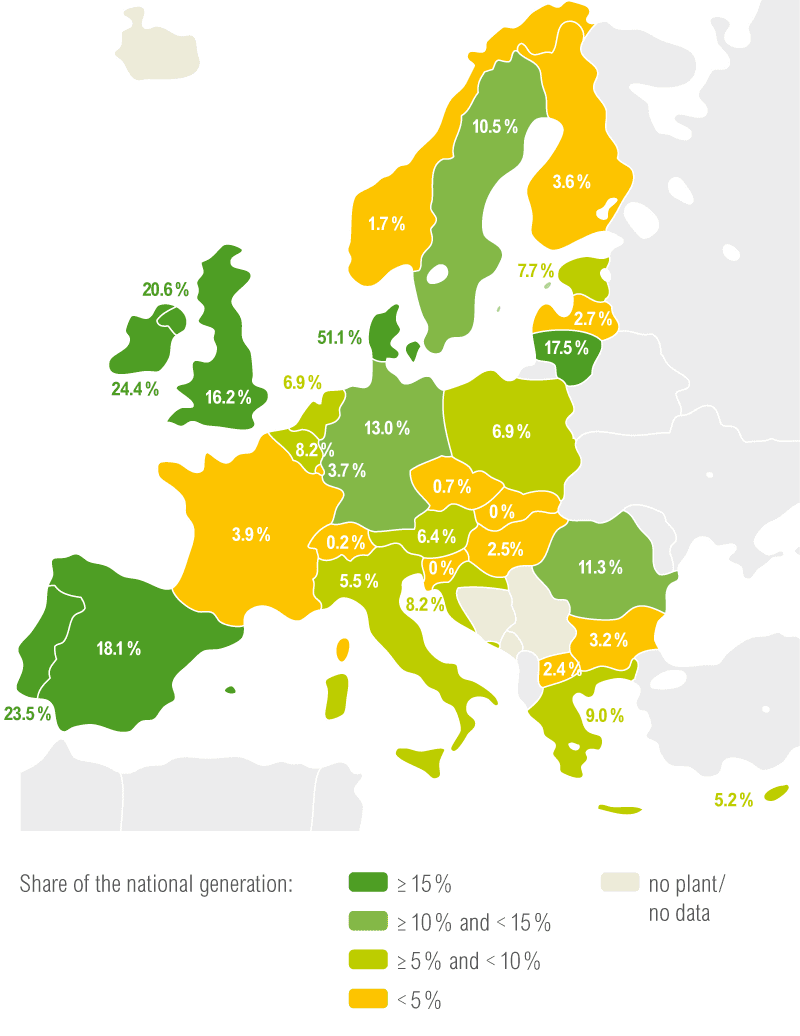
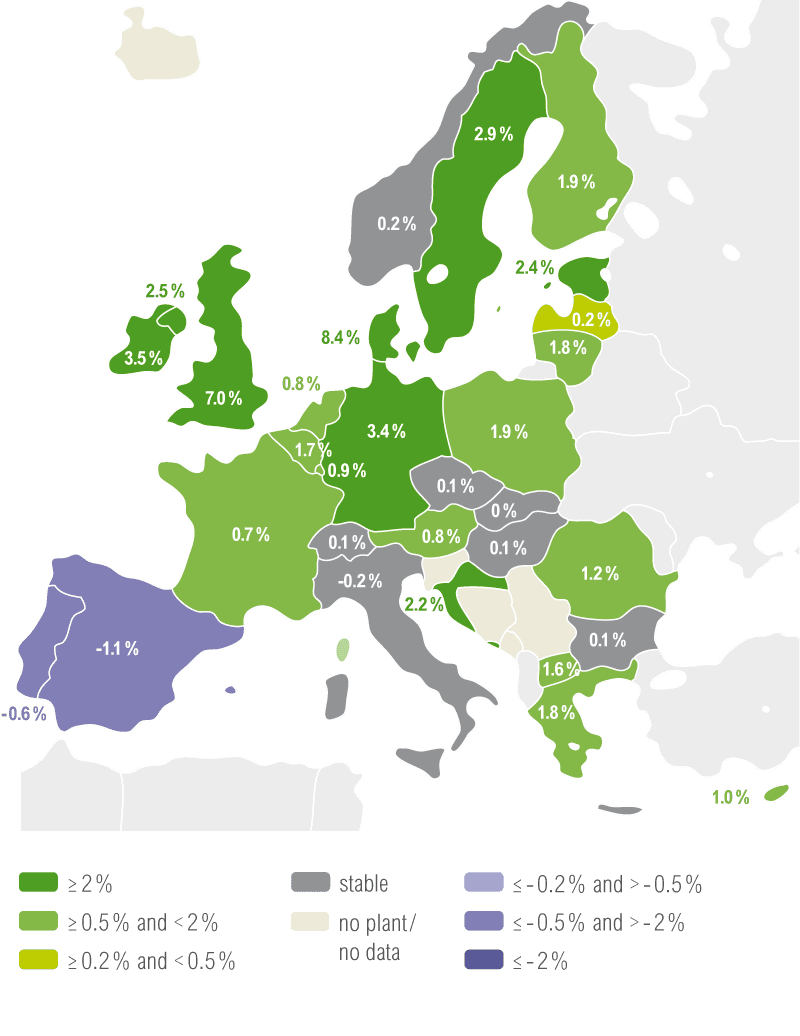
Nuclear energy
The total nuclear NGC has been rather stable in ENTSO-E, despite the fact that power plant generation can fluctuate, depending on availability. For example, the unavailability of some reactors in Belgium led to a significant drop of nuclear generation, compared to 2014.
The decreases in nuclear NGC have mainly been linked to shutdowns, such as:
- 1.3 GW in Germany (Grafenrheinfeld)
- 0.5 GW in Great Britain (Wylfa)
Share of nuclear energy net
generation in 2015
Evolution of nuclear coverage
ratio in percentage point
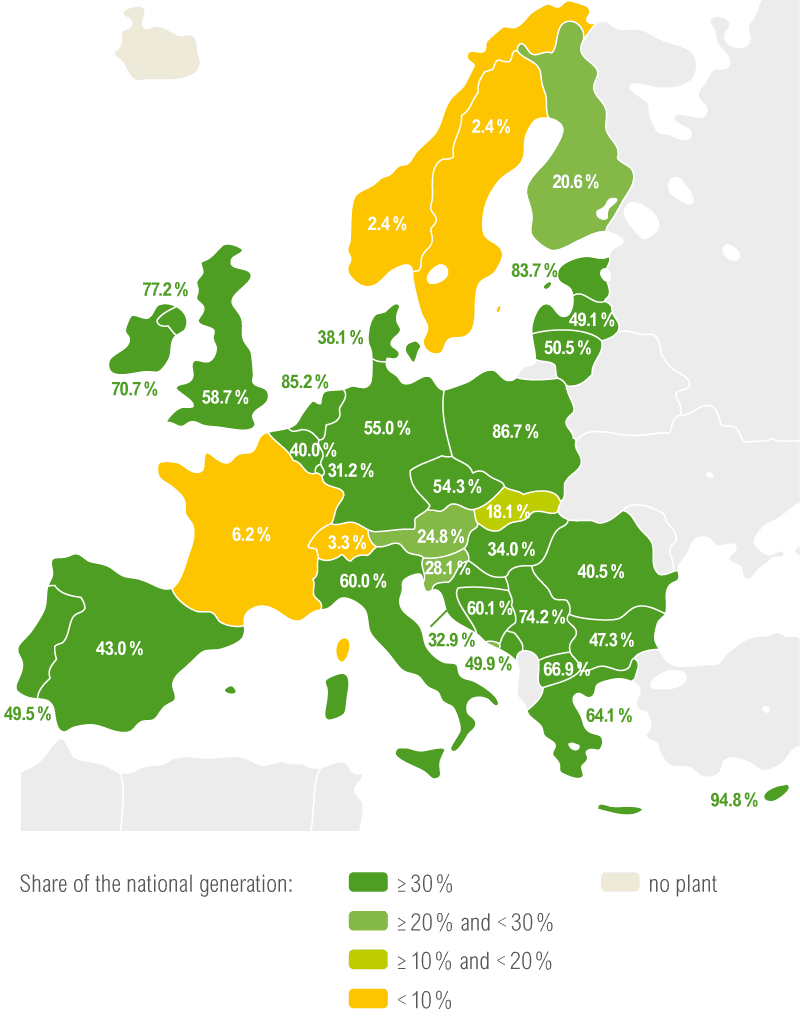
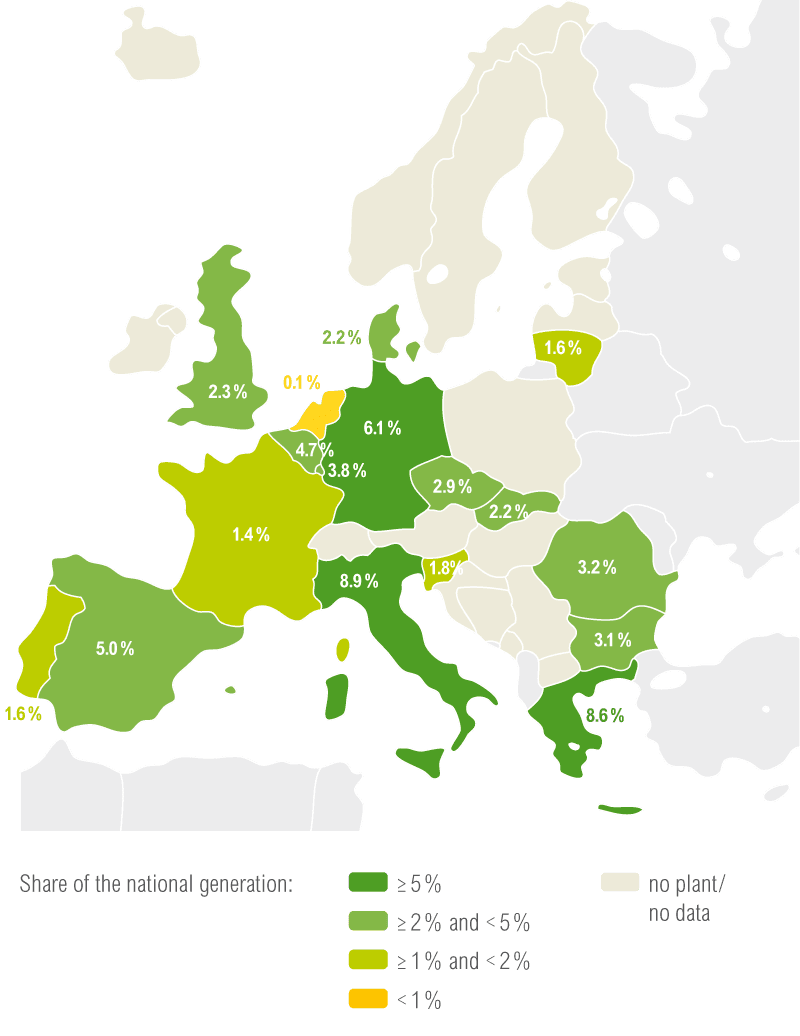
Fossil fuel
Historically, fossil fuels have been the main electricity generation source for countries with no hydro resources or nuclear plants. In recent years, the share of electricity generation from fossil fuels has decreased in all European countries, associated with the development of RES generation, and the shutdown of some thermal plants which do not meet European environmental standards. However, in 2015, fossil fuel generation increased, mainly due to a decrease in hydro and nuclear generation.
Share of fossil fuels energy net
generation in 2015
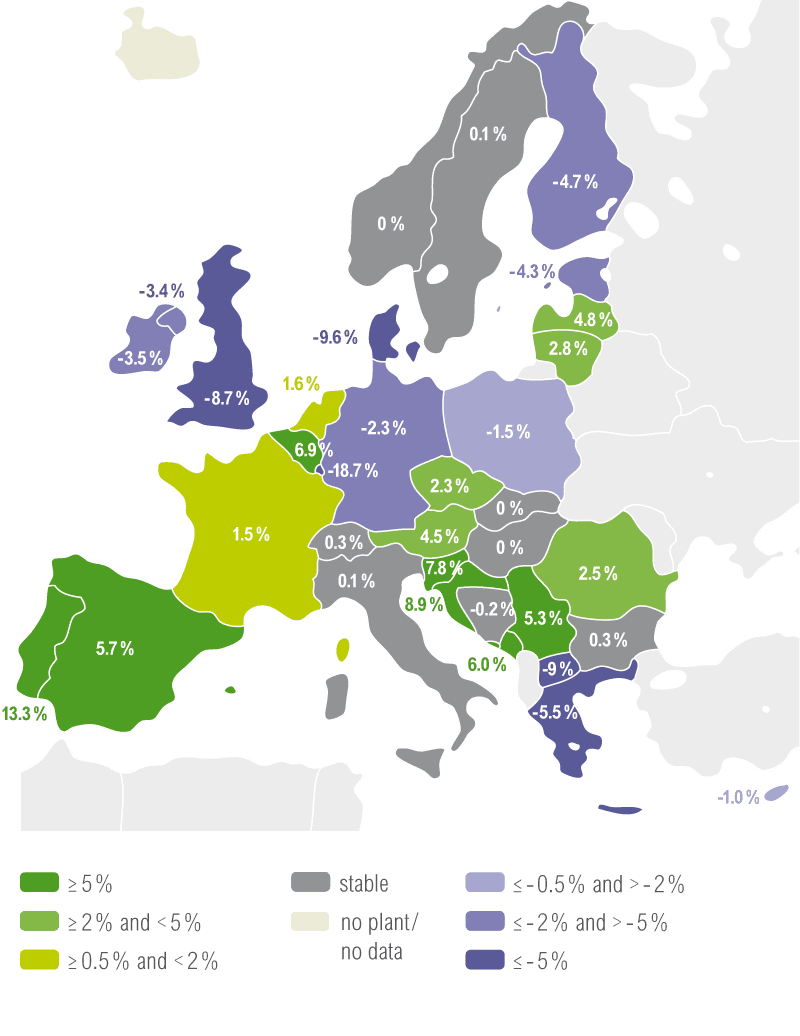
Evolution of fossil fuels coverage
ratio in percentage point
Wind energy
The evolution of electricity generated from wind (+24.5 %) is influenced by:
- the evolution of capacities, which are generally increasing throughout the ENTSO-E. Indeed, in 2015, wind NGC reached 136 GW (+10 %);
- the weather conditions of a specific year and specific country.
In 2015, the wind generation of Germany, Spain and Great Britain accounted for 57 % of total wind generation of the ENTSO-E (310 TWh).
Share of wind energy net
generation in 2015
Evolution of wind coverage
ratio in percentage point
Solar energy
Solar energy generation rose by 6 % in 2015. Similar to wind, it was triggered by an increase in capacity (+7 %) and weather conditions. Germany, Italy and Spain represent 71 % of total ENTSO-E solar generation (102 TWh).
Share of solar energy net
generation in 2015
Evolution of solar coverage
ratio in percentage point
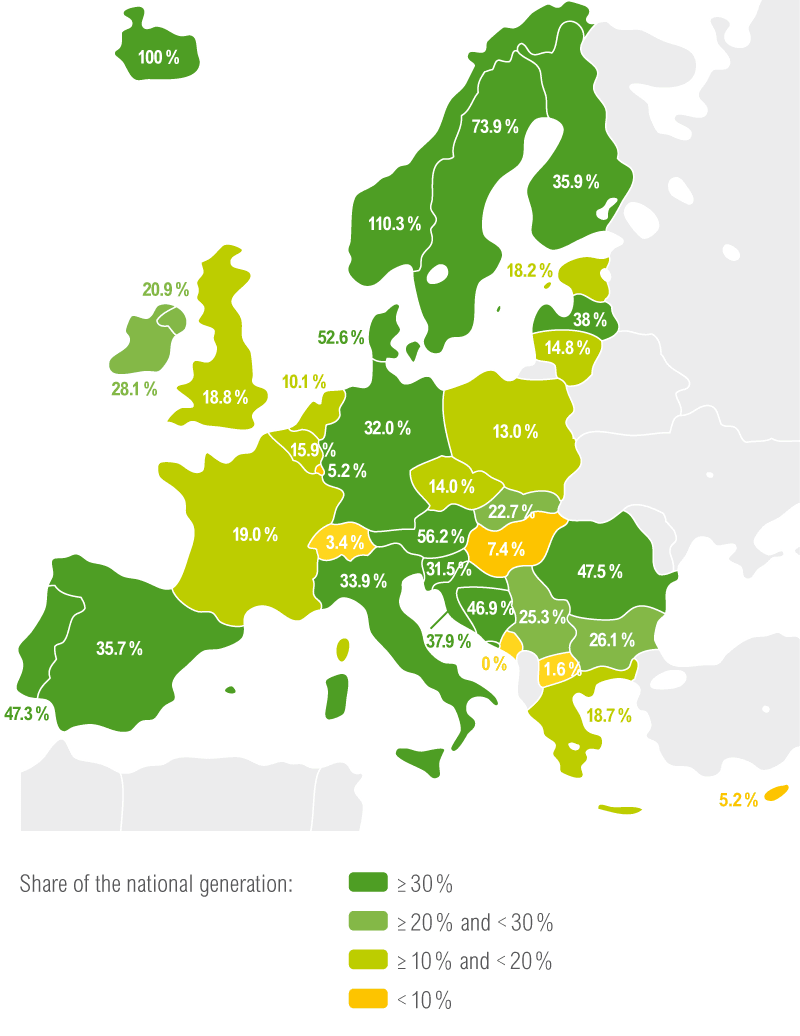
Renewable net generation per country
Renewable generation covers 31.8 % of overall ENTSO-E electricity consumption. Without hydro generation, renewable generation, mainly solar and wind, represents 16.9 % of total ENTSO-E consumption.
Share of consumption covered by renewable generation in 2015